

Most income investors have heard of dividend stocks. REITs. Covered call ETFs.
But Business Development Companies — BDCs — fly under the radar for a lot of people. And that’s a shame. Because when you find the right ones, they can deliver meaningful monthly income backed by a legal structure that most people don’t know exists.
Here’s the short version: by federal law, BDCs are required to distribute at least 90% of their taxable income to shareholders. And I want to be precise about that word — taxable income. We’re talking profits. Net investment income after expenses. Not revenue, not gross dollars flowing through the business. The actual profits the company earns from its loan portfolio. That’s what gets paid out to you.
The result is consistently high yields, paid monthly, from companies lending to the small and mid-sized businesses that keep the American middle market running.
But not all BDCs are built the same. Some are rock solid. Some are yield traps waiting to spring. And one name I’m going to show you today has a red warning banner sitting right at the top of its Seeking Alpha page.
Let’s get into it.
What to Look For Before You Buy Any BDC
Two things matter more than the yield number.
Internal vs. external management. An internally managed BDC means the people running the company are actual employees — they eat what they cook, their compensation is tied to performance, and their incentives are aligned with yours as a shareholder. An externally managed BDC means a third-party firm is running operations and collecting fees regardless of how the portfolio performs. That distinction shows up in outcomes more than most people realize.
NII coverage. Net Investment Income is what the BDC actually earns from its loan portfolio. If NII covers the distribution, the payout has a foundation. If it doesn’t — cuts happen. This is the number that predicts distribution sustainability far better than the yield percentage ever will.
Keep those two in mind as we go through the list.
First — The One-Year Picture
Before I break down each name, I want to show you the data that frames everything else.
[Portfolio comparison image — Total Return 1Y: CSWC +23.69% / MAIN -4.79% / GAIN +24.42% / GLAD -14.98% / PSEC -6.58% / PFLT -16.13%]
Total return over one year — price plus distributions combined. GAIN up 24.42%. CSWC up 23.69%. PFLT sitting at negative 16%.
Now price return only:
[Portfolio comparison image — Price Return 1Y: CSWC +10.48% / MAIN -11.66% / GAIN +16.52% / GLAD -22.92% / PSEC -23.20% / PFLT -26.82%]
GAIN up 16.52%. CSWC up 10.48%. Meanwhile PFLT, PSEC, and GLAD are all down more than 20% on price alone.
A 15% yield means nothing if the price is bleeding 25% underneath it. You can end up with less than you started. That’s the trap. Keep that chart in your head as you read through each name.
#1 — MAIN: Main Street Capital
Forward Yield: ~7.43% | Internally Managed | 1Y Total Return: -4.79%
The name most people in this space point to first — and the track record explains why.
Main Street Capital has never cut its regular monthly dividend since going public in 2007. Not in 2008. Not in 2020. Not once across nearly two decades and multiple market crises.
Current monthly distribution is approximately $0.255 per share, with semi-annual supplemental dividends layered on top when earnings support them. Internally managed, focused on lower middle market companies with $10 to $150 million in revenue.
The yield is the lowest on this list — that’s the trade-off. MAIN trades at a premium to NAV, meaning the market is pricing in the track record. The price has been down over the last year. But for investors who need to count on that monthly payment arriving regardless of what the market is doing, the distribution never wavered.
Consistency has a price. Whether that price makes sense for your situation is your call to make.
#2 — GAIN: Gladstone Investment
Forward Yield: ~5.80% | Externally Managed | 1Y Total Return: +24.42%
This one surprised me when I dug into the data.
Up 24.42% on total return over the last year. Price alone — up 16.52%. Best price performance in the group, and still paying monthly at a 5.80% forward yield.
What makes GAIN different is the hybrid model. It lends, but it also takes equity positions in its portfolio companies. When one of those companies gets sold or goes public, GAIN participates in the upside — and shareholders see that in supplemental dividends. Not on a fixed schedule, but when the portfolio generates capital gains, they show up.
Externally managed, worth noting. But the Gladstone operation has a long track record and the numbers have held up. The lower base yield reflects the equity upside component. The total return picture has done the talking over the last twelve months.
#3 — GLAD: Gladstone Capital
Forward Yield: ~8.93% | Externally Managed | 1Y Total Return: -14.98%
Same family as GAIN, different strategy entirely.
GLAD is a pure lending BDC — first and second lien debt, some mezzanine. No equity upside component. In exchange you get a higher base yield, currently around 8.93%, with a monthly distribution of $1.80 per share annually.
The price chart is harder. Down roughly 23% on price over the last year, negative 14.98% on total return. That’s real and worth sitting with.
GLAD has continued paying its monthly distribution through a rough period for private credit broadly. NII coverage is the number to watch most closely here. If profits are still covering the payout, the distribution can hold even under price pressure. If coverage starts to slip, the picture changes quickly.
Higher yield, more volatility. Do your homework on the coverage ratio before making any decisions here.
#4 — CSWC: Capital Southwest
Forward Yield: ~10.01% | Internally Managed | 1Y Total Return: +23.69%
This is the one I want to spend the most time on — and I’ll be upfront that I’ve personally owned this name.
Capital Southwest recently converted from quarterly to monthly distributions. The current monthly payment is $0.1934 per share, plus a quarterly supplemental dividend of $0.06 per share. Annualized, you’re looking at a forward yield right around 10%.
Internally managed. That’s the first thing I noted when I started following this one closely. The team running this company are employees with real alignment to shareholder outcomes.
Middle market lending out of Dallas. Portfolio around $2.1 billion in investments, credit quality holding up, non-accruals minimal. Total return over the last year — up 23.69%. Price alone, up 10.48%. Income and price appreciation moving in the same direction over the same period.
The move to monthly distributions is significant for income investors specifically. Quarterly income is harder to plan around when you’re living off your portfolio. Monthly aligns with how expenses actually work. That structural change is part of why this one stays on my radar.
#5 — PSEC: Prospect Capital
Forward Yield: ~18.42% | Externally Managed | 1Y Total Return: -6.58%
I’m going to be direct here.
That 18.42% yield will catch your eye. It should — it’s an extraordinary number. But before anyone goes near this one, the full picture matters.
PSEC is down 23.20% on price over the last year. Wall Street has it rated Strong Sell. Externally managed. And it has a documented history of distribution cuts — during the pandemic and in prior cycles.
An 18% yield that gets cut in half isn’t an 18% yield. And if the price is simultaneously declining, the total return looks nothing like that headline number when you first saw it.
I’m including it because it exists and people find it. It shows up in searches, in forums, in income investing communities. If it’s in your research — go in with complete awareness of the cut history, a clear view on current NII coverage, and a position size that honestly reflects the actual risk level.
The Warning Label: PFLT — PennantPark Floating Rate Capital
Forward Yield: ~12.82% | Externally Managed | 1Y Total Return: -16.13%
This one isn’t in the top five. It’s here as a teaching moment.
Open PennantPark Floating Rate Capital’s page on Seeking Alpha and the first thing you see is a red banner: “Warning: PFLT is at high risk of cutting its dividend.”
That’s the platform’s own analytical signal. Not editorializing.
Down 26.82% on price over the last year. Negative 16.13% on total return. Dividend safety grade — F.
Here’s the pattern worth understanding. PFLT built its portfolio around floating-rate loans — that logic made sense when rates were rising. But when borrowers start to struggle and non-accruals climb, income gets squeezed regardless of what rates are doing. And when profits can no longer cover the distribution, cuts happen.
We saw this in 2020. Several BDCs cut their distributions. The ones that didn’t — conservative leverage, disciplined underwriting, internal management — held the line. The ones that did cut followed a recognizable pattern first. Prices falling while yield numbers climbed higher as the price dropped. Coverage ratios slipping quietly before any public announcement.
PFLT is showing several of those signals right now. A yield that rises because the price is falling isn’t always a buying opportunity. Sometimes the market is telling you something the next press release hasn’t said yet.
Know the signs before you chase the number.
The Summary
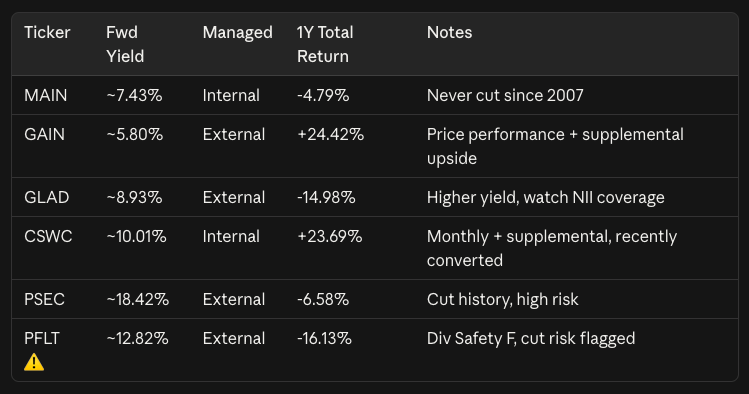
The pattern in that total return column is worth sitting with. The two internally managed names — CSWC and GAIN — are the only ones in positive territory over the last year. That’s not a coincidence.
Where I Land Personally
I’ve owned two names on this list. MAIN and CSWC — both earlier in my income investing journey.
I’m not currently in either one, and I want to be honest about why.
Right now I’m still in a building phase. Active income is still coming in and that’s serving as a safety net while the portfolio grows. In this phase I’ve leaned toward higher-yield instruments in my Income Engine bucket — covered call ETFs, sector plays. Maximum cash flow generation while I’m actively adding to the snowball.
BDCs — the quality names, the internally managed ones with real track records — I see those fitting a different phase. When I’m fully stepped away from active income. When the portfolio needs to sustain itself without me watching it as closely. When reliable monthly income becomes more valuable than maximum yield. That’s when something like MAIN or CSWC starts to make more sense in the mix.
I’ll be coming back to this space. And when I do, I’ll document it right here — what I’m buying, why, and what the real income impact looks like in actual dollars. That’s the whole point of doing this in public.
A Note on Research
All the data in this post came from Seeking Alpha — the factor grades, dividend safety scores, yield figures, and that red warning banner on PFLT. Not a sponsor, but I’m an affiliate and it’s been genuinely vital to how I research income investments. If you want to do this kind of analysis yourself, it’s one of the most useful platforms I’ve found. Link is in the description on the YouTube video.
I’m not a financial advisor. Everything here is what I’m personally researching and doing with my own money. Always do your own due diligence before investing your hard-earned dollars.
Are you currently holding any BDCs? Which one — and what’s your thinking behind it? Drop it in the comments. I read every one.
If you want to build your first income portfolio from the ground up, my Freedom Builder Bootcamp walks you through the entire foundation in 30 days. It's designed to get you set up and moving — no guesswork, no overwhelm. Check it out here.
— Rico