

People keep asking me about QDTE.
And I get it. When you’re building an income portfolio and someone shows you a 50% yield, your brain does exactly what it’s supposed to do. It pays attention.
So I finally did what I should have done months ago. I pulled a full year of data — QDTE, GPIQ, and QQQI — side by side in Snowball Analytics. Same time period. Same benchmark. Total return, price change, yield history, payout consistency. Everything.
And the results told a more complete story than the headline yield number ever could.
This is that story.
The Three ETFs
Before we get into the data, a quick setup. All three of these ETFs track the Nasdaq-100. All three generate income through covered call strategies. That’s where the similarities end.
QDTE — Roundhill Nasdaq-100 0DTE Covered Call Strategy ETF. Sells options contracts that expire the same day they’re written. Daily premium collection. Weekly distributions. Current forward yield: 20.26%. Expense ratio: 0.95%.
GPIQ — Goldman Sachs Nasdaq-100 Core Premium Income ETF. More conservative covered call overlay. Monthly distributions. Current yield: 9.8%. Expense ratio: 0.29%.
QQQI — NEOS Nasdaq-100 High Income ETF. My largest holding. Uses Section 1256 contracts — which carry a meaningful tax advantage I’ll explain. Monthly distributions. Current yield: 13.62%. Expense ratio: 0.68%.
Same index. Three different income strategies. Let’s see what a year of data actually shows.
The Yield Story — And Why It’s More Complicated Than It Looks
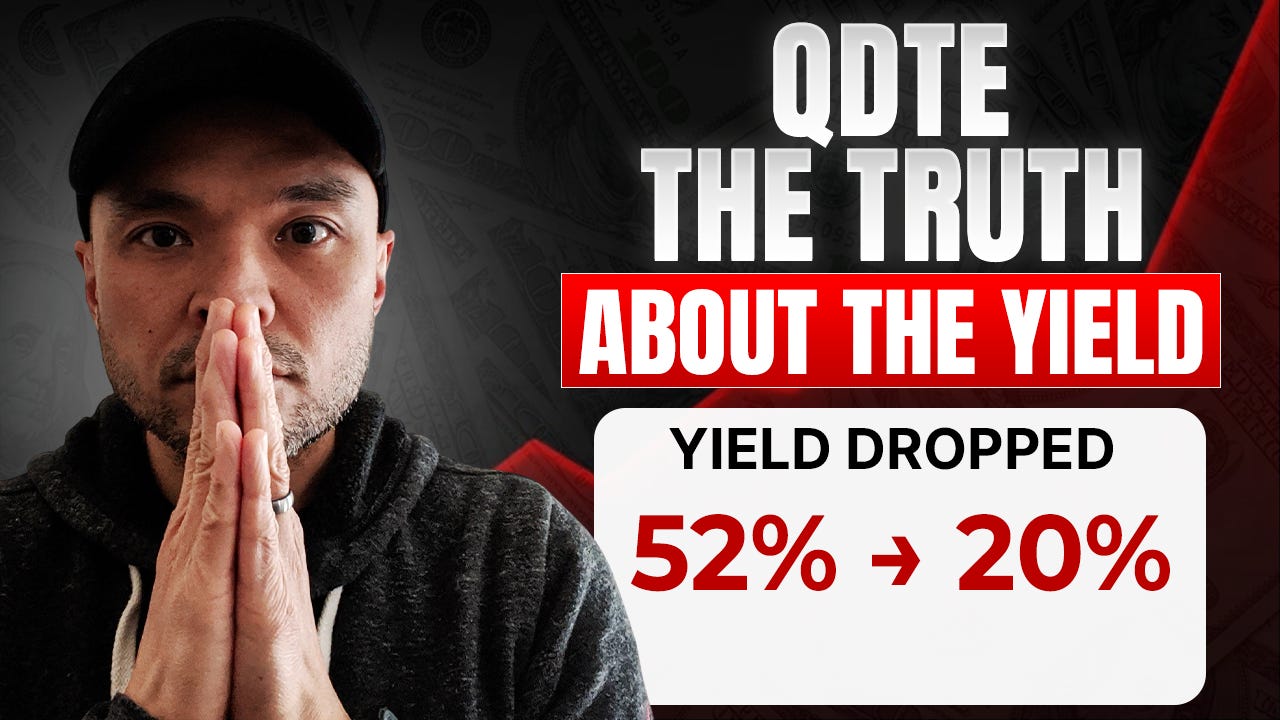
Here’s the number that started all the QDTE hype: a trailing twelve-month yield that peaked at 52.15%.
That’s real. That’s documented. At its high point, QDTE was genuinely delivering over 50% in trailing yield. The twelve-month average? 43.85%.
But here’s where it gets interesting.
Look at what happened after April. The yield started declining. It peaked at 52%, came down steadily, and the current forward yield — what QDTE is actually paying right now — is 20.26%. More than cut in half from the peak in under six months.
Why? Because the NAV eroded. When the share price falls, there’s less capital available to write options on. Less capital means smaller premiums. Smaller premiums mean smaller distributions. Which pushes the forward yield down — even as the share price keeps declining.
The yield erosion and the NAV erosion are directly connected. That’s not a coincidence. That’s the structure of the trade.
Now compare that to QQQI and GPIQ.
QQQI’s trailing yield over the same 12 months ranged from 13.17% to 15.54%, averaging 13.88%. A tight two-point band. Predictable. Consistent.
GPIQ’s range: 9.13% to 11.02%, averaging 9.88%. Even tighter. Almost flat.
QDTE’s yield swung nearly 17 percentage points over 12 months. QQQI moved about 2 points. GPIQ moved less than 2 points.
In retirement, income predictability isn’t a nice-to-have. It’s the whole game. You can’t run a household budget on a distribution that swings 17 points.
The Payout History — This Is Where It Gets Real
Yield percentages are one thing. Actual dollar distributions hitting your account are another.
QQQI’s payout history over 12 months: remarkably flat monthly bars, roughly $0.42–$0.52 per share every single month. Small upticks when volatility was high. Small dips when things calmed down. But always showing up. Always in the range. Forecasted distributions continuing at the same level.
GPIQ’s payout history: even more consistent than QQQI. Monthly bars that barely move — roughly $0.52–$0.65 per share — with a slight upward trend over the year. A growing, stable income stream from a strategy that isn’t burning through its capital to pay you.
QDTE’s payout history: this is the chart that tells the whole story.
Weekly distributions, mostly in the $0.05–$0.15 range across the year. And then — January 2026 — two massive spikes. Nearly $1.90 and $1.70 in consecutive weeks. That was a volatility event. The market moved hard and QDTE’s 0DTE options premiums spiked with it. The strategy did exactly what it was designed to do.
But look at everything else around those spikes. Tiny bars. And look at the right side of the chart — the most recent weeks. The bars are getting smaller as the NAV declines.
Two massive distributions buried in a year of small, inconsistent ones.
If you’re trying to cover a mortgage payment, a utility bill, or a grocery run on a fixed monthly schedule — you cannot plan around this. That income is real, but it’s unpredictable in a way that makes budgeting nearly impossible.
The Total Return Picture
Now let’s put it all together. Price appreciation plus distributions. The full picture.
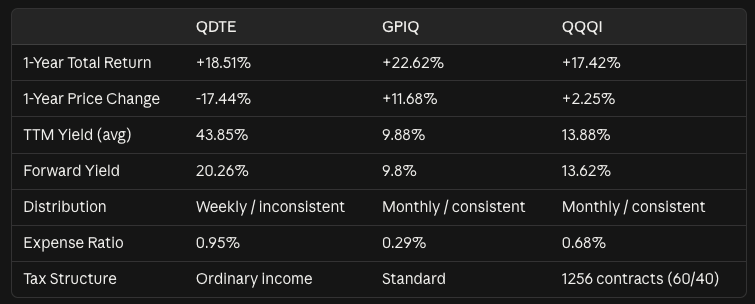
Over 12 months ending September 22, 2026:

The ETF with the lowest yield produced the best total return.
GPIQ, at 9.8% yield, outperformed QDTE — which averaged 43.85% TTM yield — by four full percentage points on total return. That is the headline.
And look at the price-only column.
QDTE’s share price dropped $6.24 per share over 12 months — a 17.44% decline. The distributions were real. But the value of the account generating those distributions shrank significantly in the same period.
QQQI’s NAV: up 2.25%. My cost basis is $53.037 per share. I’m above water, collecting 13.62% in income. The engine is sustaining itself.
GPIQ’s NAV: up 11.68%. The share price moved with the market. That engine is growing.
Past performance is not a guarantee of future results. But it gives us a sense — not certainty — of what we might expect.
Where Does QDTE Actually Fit For Me?
Let me be direct. Because this is the whole reason I did this analysis.
I would not use QDTE as a retirement tool. Full stop.
Here’s my thinking across three areas.
The engine has to sustain itself. A retirement portfolio isn’t a one-year trade. You need it running for 20, 30, maybe 40 years. If the NAV is declining 17% in year one, your income base is smaller in year two. Fewer dollars generating options premium means smaller distributions the year after that. We already watched this play out in real time — QDTE’s yield went from 52% to 20% as the NAV declined. That’s not hypothetical. That happened over the past 12 months.
The income has to be plannable. QQQI and GPIQ deliver flat, consistent, predictable monthly distributions you can build a real budget around. QDTE delivers small weekly distributions with unpredictable spikes tied to volatility events. When the market is calm — which is most of the time — the distributions are small. When things get volatile, they spike. You can’t plan around that in retirement.
Cost and tax structure matter more than most people think. QDTE runs a 0.95% expense ratio. GPIQ is at 0.29%. That 0.66% difference compounds against you every year without a single market move. And QQQI’s Section 1256 contract structure means 60% of gains are taxed at long-term capital gains rates regardless of how long you’ve held it. In a taxable account, that’s real money you keep instead of sending to the IRS. Every dollar has a job. Don’t give more of them to the government than you have to.
Could QDTE play a short-term role? Maybe. Small allocation, Income Engine bucket, eyes open to the NAV erosion — there’s a version of that argument. But even that case has gotten harder to make. When QDTE was averaging 43% yield, the accelerator story had some math behind it. At 20% forward yield today? QQQI does that job better. More consistent income. Stable NAV. Better tax structure. Lower cost. There’s no lane left where QDTE wins for me personally.
The Bottom Line
QDTE is not a retirement engine. It’s a yield accelerator — and right now, at 20% forward yield with declining NAV, even the accelerator case is a stretch.
QQQI remains my largest holding for a reason. And GPIQ is a name I’m watching closely.
All data pulled from Snowball Analytics — the tool I use every day to track my portfolio income down to the exact amount and the exact day. If you’re not using Snowball to track your income portfolio, you’re flying blind. Check it out here.
Start with the Freedom Calculator — it’s free.
Before you buy a single share of anything, know your number. The Freedom Calculator tells you exactly how much monthly income you need to replace your salary and how long it’ll take to get there. Find it here.
Want to go deeper? I break down the full portfolio — allocations, bucket structure, and the thinking behind every position — inside my Substack community. That’s where the real conversations happen.
And if you’re ready to build your first income portfolio from scratch, the Freedom Builder Bootcamp walks you through it in 30 days. Real structure. Real foundation. Not just a ticker list.
I am not a financial advisor. Everything here is what I’m personally researching and doing in my own portfolio. This is educational — not advice. Always do your own research.
Are you holding QDTE right now? Is it a small tactical position or is it doing heavier work in your portfolio? Drop it in the comments — I read them all and these conversations shape what I cover next.